

Consumer Financial Health: Navigating Record Highs and Historic Lows
Consumer spending serves as the primary driver of the U.S. economy, representing approximately two-thirds of total economic activity. When consumers feel financially secure and confident about the future, they tend to spend more, which supports corporate earnings and broader economic growth. When uncertainty rises, spending behavior can shift. In practice, consumer behavior is shaped by a wide range of factors, and not all consumers experience the economy in the same way. For this reason, developing a well-rounded understanding of consumer financial health is one of the most valuable tools available to long-term investors seeking to interpret the current environment.
The current picture is broadly positive but contains notable contradictions. On the favorable side, household net worth is near all-time highs, labor market conditions have improved, retail sales remain strong, and gasoline prices have been declining. At the same time, consumer sentiment is hovering near historic lows, the personal savings rate has dropped considerably, debt levels remain elevated, and inflation continues to exceed the Federal Reserve's target.
These competing signals point to an economy that is broadly performing well, while also leaving certain households feeling financially strained. For long-term investors, recognizing both sides of this dynamic is essential for understanding economic trends and the continued importance of adhering to a financial plan.
Consumers are feeling pessimistic despite healthy growth
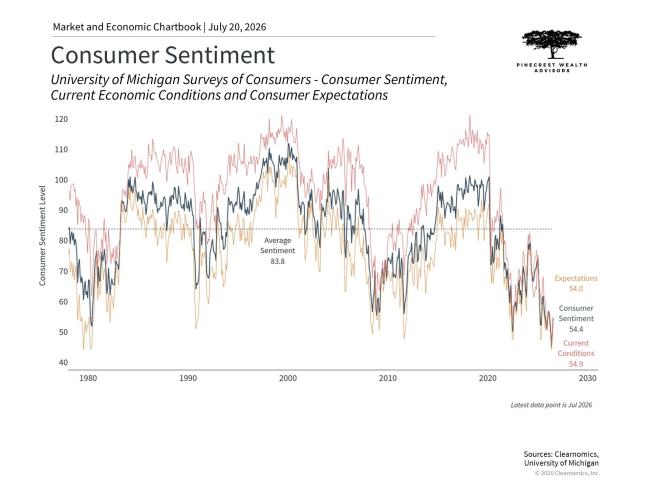
According to the University of Michigan Surveys of Consumers, the consumer sentiment index registered 49.5 in June 2026, substantially below the historical average of 83.8. This places sentiment near its all-time low, at levels comparable to those observed during the height of the 2008 financial crisis and the early months of the pandemic. Oneyear inflation expectations from the same survey have risen to 4.6%, indicating that concerns about the cost of living remain a central factor behind this pessimism.1
Although one might expect a direct relationship between how consumers feel and how they actually spend, this link is not always straightforward. Sentiment surveys are based on representative samples, which can introduce data challenges, and there is often a meaningful difference between how respondents describe their outlook and the choices they make in practice. As an illustration, retail sales have grown 6.9% year-over-year in the most recent report, a pace well above the long-term historical average of 4.7%.2
What accounts for this divergence? A significant part of the explanation lies in the cumulative inflation that consumers have experienced over recent years. Even though the rate of price increases has moderated, the overall level of prices for everyday goods and services remains considerably higher than before the pandemic. Households that feel the ongoing burden of elevated grocery, housing, and energy costs may express pessimism in surveys while still spending on necessities and some discretionary items.
The labor market, while trending in a more positive direction, also carries uncertainty tied to the potential effects of artificial intelligence on employment. Wage growth has moderated as well, even though it remains at a historically solid annual rate of 3.6%. The complication is that this pace falls below recent inflation readings driven by energy prices. Concerns spanning these multiple dimensions may influence how households view the future, even when they continue making day-to-day purchases.
Household net worth reflects the strength of the economy and markets
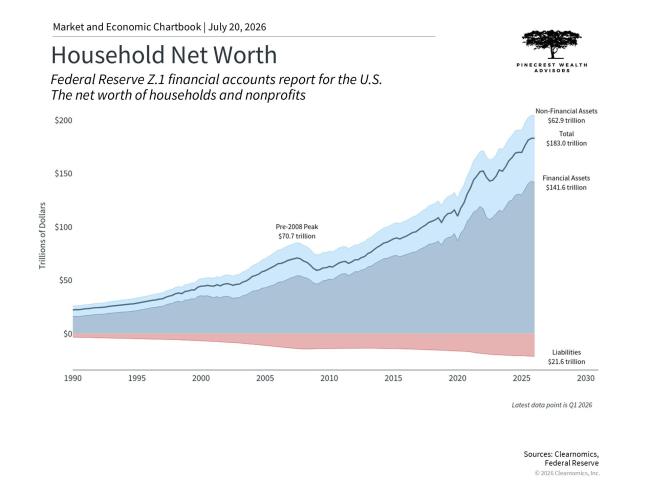
Although sentiment remains subdued, the aggregate balance sheet of American households has reached its strongest point on record. Total U.S. household net worth climbed to $183 trillion in the first quarter of 2026, an all-time high. Financial assets, including equities and retirement accounts, have expanded meaningfully over the current market cycle, propelled by stock market performance. Nonfinancial assets such as residential real estate have also appreciated considerably over recent years.3
This aggregate figure, however, obscures significant variation across income and wealth groups. A widely used description of the current environment is the "K-shaped" economy. Households with substantial exposure to financial assets and real estate have seen their balance sheets strengthen considerably. Powered by Clearnomics 2 For those without such assets, wage growth has been robust, but debt levels have also been rising steadily across the country. This includes credit card debt increasing to $1.3 trillion, auto loans reaching $1.7 trillion, and student loan balances also climbing to $1.7 trillion. 4
The wealth effect, which describes the tendency for consumers to increase spending when they feel wealthier, helps explain why aggregate spending has remained resilient even as sentiment has softened. This dynamic carries different implications depending on the lens applied. From the perspective of overall economic health, broader participation in financial growth across population segments is clearly preferable. From a market and portfolio standpoint, what matters most is the trajectory of earnings growth. Challenges experienced by certain segments of the population do not automatically translate into concerns for investors.
Savings rates have declined from historical norms
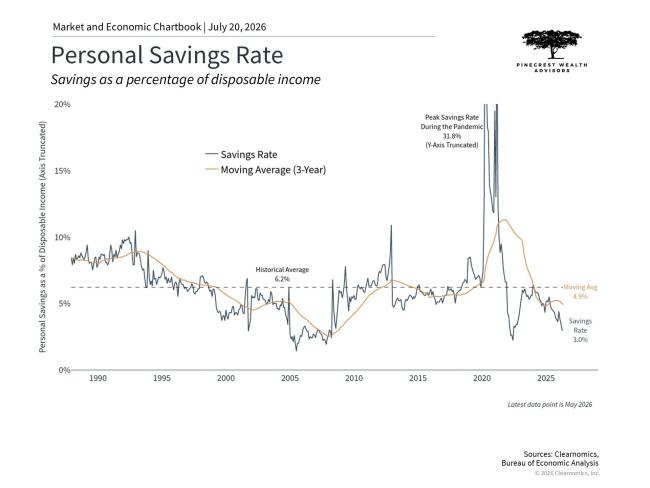
The personal savings rate, which measures the share of after-tax disposable income that individuals set aside, has fallen to 3.0%, well below the historical average of 6.2%. For much of the 20th century, this rate was considerably higher, averaging 11.1% from 1960 to 1990. The current level also represents a sharp reversal from the pandemic period, when savings rates briefly surged above 30% as households received government support and faced limited opportunities to spend.5
The drivers behind this decline are once again tied to inflation and energy prices. Sustained strong consumer spending means that the average household has directed more of its income toward purchases rather than savings. Higher prices for necessities, including gasoline, reduce the portion of each paycheck available to set aside. Demographic trends also contribute to this pattern. As the Baby Boomer generation advances further into retirement, aggregate savings rates naturally fall as retirees draw down accumulated wealth. These population shifts help explain why the savings rate has trended lower over the past several decades.
A savings rate of 3.0% may leave many households with limited cushion against unexpected expenses or major life events. From a financial planning standpoint, this represents an important area of attention. For long-term investors, the compounding effect means that dollars saved early in a financial plan can grow substantially over time.
Looking at the broader picture, a number of trends are moving in a constructive direction. Oil prices have retreated from recent highs, which could provide some relief from inflation and help ease some of the pressure weighing on consumer sentiment. The labor market has also shown improvement in hiring activity, and unemployment remains at a low level. These are encouraging developments for household finances and for the overall consumer outlook.
The bottom line? Consumer spending has been resilient overall, supporting the economy and markets despite mixed signals. For investors, this reinforces both the importance of building a financial plan and staying focused on longer-term trends.
References
- https://www.sca.isr.umich.edu
- https://www.census.gov/retail/sales.html
- https://www.federalreserve.gov/releases/z1
- https://www.federalreserve.gov/econres/scfindex.htm
- https://www.bea.gov/data/income-saving/personal-saving-rate
Securities and advisory services offered through LPL Financial, a registered investment advisor. Member FINRA/SIPC; All investing involves risk including loss of principle. No strategy assures success or protects against loss.
Financial Advisors do not provide specific tax/legal advice and this information should not be considered as such. You should always consult your tax/legal advisor regarding your own specific tax/legal situation.
Separate from the financial plan and our role as a financial planner, we may recommend the purchase of specific investment or insurance products or account. These product recommendations are not part of the financial plan and you are under no obligation to follow them.
Life insurance products contain fees, such as mortality and expense charges (which may increase over time), and may contain restrictions, such as surrender periods.
Securities and Advisory Services offered through LPL Financial, a Registered Investment Advisor. Member FINRA & SIPC.
This material is for general information only and is not intended to provide specific advice or recommendations for any individual. There is no assurance that the views or strategies discussed are suitable for all investors or will yield positive outcomes. Investing involves risks including possible loss of principal. No investment strategy or risk management technique can guarantee return or eliminate risk in all market environments Any economic forecasts set forth may not develop as predicted and are subject to change.
References to markets, asset classes, and sectors are generally regarding the corresponding market index. Indexes are unmanaged statistical composites and cannot be invested into directly. Index performance is not indicative of the performance of any investment and do not reflect fees, expenses, or sales charges. All performance referenced is historical and is no guarantee of future results.
This information is not intended to be a substitute for specific individualized tax or legal advice. We suggest that you discuss your specific situation with a qualified tax or legal professional.
Bonds are subject to market and interest rate risk if sold prior to maturity. Bond values will decline as interest rates rise and bonds are subject to availability and change in price.
U.S. Treasury securities are guaranteed by the federal government as to the timely payment of principal and interest. The principal value of Treasury securities and other bonds fluctuates with market conditions.
International investments carry additional risks, which include differences in financial reporting standards, currency exchange rates, political risks unique to a specific country, foreign taxes and regulations, and the potential for illiquid markets. These factors may result in greater share price volatility.
This material was prepared by Clearnomics, Inc., who is not affiliated with the named financial professional, firm or broker/dealer.
Copyright (c) 2026 Clearnomics, Inc. All rights reserved. The information contained herein has been obtained from sources believed to be reliable, but is not necessarily complete and its accuracy cannot be guaranteed. No representation or warranty, express or implied, is made as to the fairness, accuracy, completeness, or correctness of the information and opinions contained herein. The views and the other information provided are subject to change without notice. All reports posted on or via www.clearnomics.com or any affiliated websites, applications, or services are issued without regard to the specific investment objectives, financial situation, or particular needs of any specific recipient and are not to be construed as a solicitation or an offer to buy or sell any securities or related financial instruments. Past Powered by Clearnomics 5 performance is not necessarily a guide to future results. Company fundamentals and earnings may be mentioned occasionally, but should not be construed as a recommendation to buy, sell, or hold the company's stock. Predictions, forecasts, and estimates for any and all markets should not be construed as recommendations to buy, sell, or hold any security--including mutual funds, futures contracts, and exchange traded funds, or any similar instruments. The text, images, and other materials contained or displayed in this report are proprietary to Clearnomics, Inc. and constitute valuable intellectual property. All unauthorized reproduction or other use of material from Clearnomics, Inc. shall be deemed willful infringement(s) of this copyright and other proprietary and intellectual property rights, including but not limited to, rights of privacy. Clearnomics, Inc. expressly reserves all rights in connection with its intellectual property, including without limitation the right to block the transfer of its products and services and/or to track usage thereof, through electronic tracking technology, and all other lawful means, now known or hereafter devised. Clearnomics, Inc. reserves the right, without further notice, to pursue to the fullest extent allowed by the law any and all criminal and civil remedies for the violation of its rights.
