

What Tariff Refunds and the National Debt Mean for Your Investments
Since new tariffs (which are fees charged on imported goods) were announced last year, global trade has been a major source of uncertainty for financial markets and the broader economy. In February, the Supreme Court ruled that the original "Liberation Day" tariffs were illegal. This led to a wave of refunds being paid back to businesses, a process that is now well underway. 1 New tariffs have since been put in place under different laws, including recently with close trading partners such as Canada.
At the same time, these tariff refunds have increased the federal budget deficit (the gap between what the government spends and what it collects). The national debt, which is the total amount the government owes, has now surpassed $40 trillion for the first time, raising questions about how much it will cost the government to borrow money over the long term.
2 While some investors have understandable concerns about these developments, the effect on investment portfolios has been limited. In fact, markets have done well during this period, with broad market indexes reaching new all-time highs. This highlights how important it is for investors to keep these events in perspective. Throughout history, markets have performed well across many different trade and fiscal environments. So what do investors need to know about the latest developments?
Tariff refunds are being returned to businesses
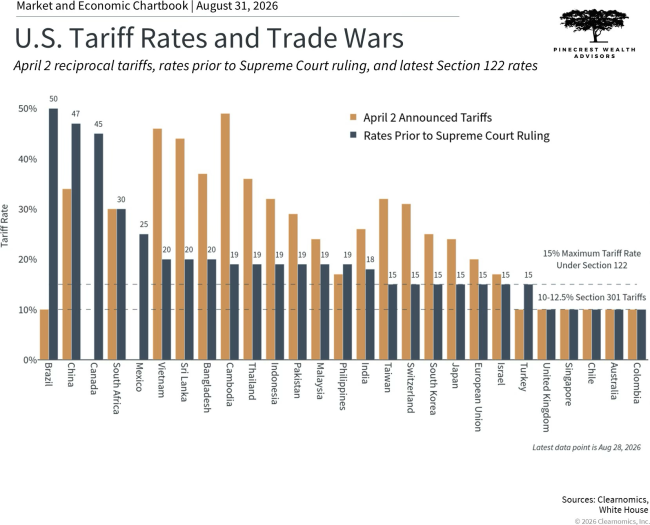
When the Supreme Court ruled in February that billions of dollars in tariffs collected under the International Emergency Economic Powers Act (IEEPA) had been unlawfully imposed, markets generally reacted in a positive way. This is because tariffs are typically seen as an added cost for consumers, so reversing them was expected to help the overall economy.
Since then, companies that had paid those tariffs became eligible to receive refunds, which are currently being paid out. According to U.S. Customs and Border Protection, $129 billion in refund claims had been accepted for processing, representing a significant portion of the total amount owed.3 Data from the U.S. Treasury shows that tariff refunds have been greater than new tariff collections since May, meaning the government has been paying out more than it has been taking in for three months in a row.4
Specifically, June saw the largest single monthly amount of tariff refunds ever recorded, with $49.2 billion returned to businesses compared to only $23.6 billion collected. With roughly 40% of the total refunds still to be processed, the government is likely to continue paying out more than it collects in the months ahead.
On the surface, these refunds could act like a stimulus, meaning they could give companies more cash to support their operations and investments. However, it is important to remember that businesses originally paid this money in the first place. So while markets may view the refunds as a positive sign, they are largely a one-time event. They do not represent a lasting improvement in how businesses are performing, and they simply reverse last year's tariff payments. Additionally, many companies continue to pay tariffs under different laws.
For consumers, one concern was that tariffs could cause inflation (a general rise in prices). However, this did not happen to the degree many expected, since many retailers absorbed the extra costs or passed them on in indirect ways. This is one reason tariffs did not hurt consumer spending as much as some had feared. It also makes it difficult to trace exactly how refunds will benefit everyday households. For example, some shipping companies have begun returning refunds to customers who paid tariff surcharges directly, while some larger retailers have pledged to pass on savings through lower prices rather than direct payments.
Tariff refunds have added to the deficit and national debt
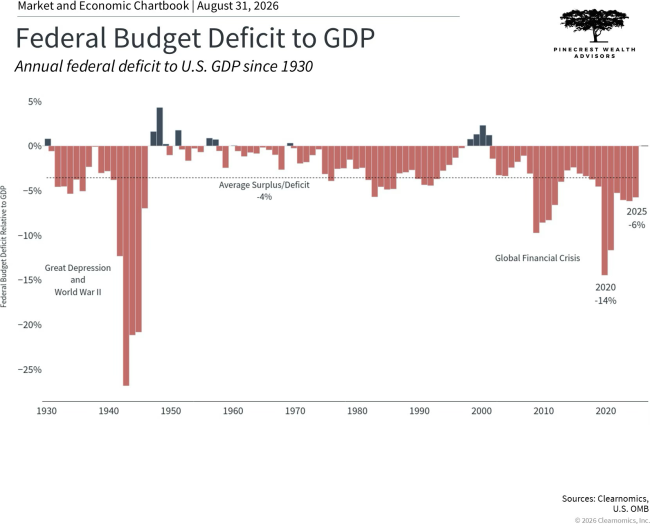
Tariff refunds have also reversed the boost that tariffs gave to government revenues over the past year. The current annual deficit already stands at approximately $1.8 trillion, even though the fiscal year (the government's 12-month budget period) does not end until September. This already surpasses the full-year 2025 deficit.5 The Congressional Budget Office, which is a nonpartisan government agency that analyzes the federal budget, recently projected the full-year deficit will reach $2.1 trillion, roughly $200 billion more than was estimated earlier in the year.6
This means the national debt now exceeds $40 trillion for the first time in history. This figure has grown steadily over decades as annual deficits have piled up year after year. The accompanying chart shows this long-run trend, with each year's deficit adding to the total debt. Tariff refunds are contributing to the deficit in the near term, but it is important to keep in mind that tariffs alone cannot close the budget gap. Larger and more complex issues, such as entitlement programs including Social Security and Medicare, are much bigger drivers of the deficit and are difficult to address.
While many investors are understandably concerned about the national debt, history shows that it is important to separate these issues from how we invest and plan our financial futures. Since 1970, the federal government has run a deficit in all but five years, with only four surpluses occurring in the past thirty years. And yet, balanced portfolios (investments spread across different types of assets) have performed well over this period. Moreover, the deficit is often at its highest when markets and the economy are going through difficult times, which can coincide with market bottoms. So while the past is no guarantee of the future, and the size of the national debt does create challenges, making investment decisions based on this factor alone has historically been counterproductive.
The government is working to manage interest rates
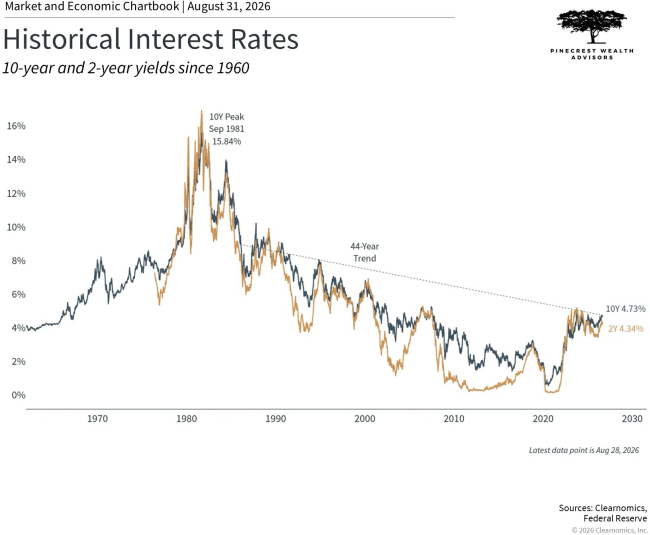
Another effect of rising debt is its impact on interest rates, which are the cost of borrowing money. Long-term interest rates have climbed to their highest levels in several decades recently. This matters because when yields (the return paid to bond investors) on 10-year and 30-year U.S. Treasury bonds rise, borrowing becomes more expensive for businesses and households alike.
To help manage this, the Treasury Department has increased its purchases of U.S. Treasury securities through a process called buybacks. This is intended to help keep interest rates within a certain range.7 Other Treasury activities, such as supporting the Japanese Yen (Japan's currency), may seem unrelated at first. However, these efforts are also designed to prevent governments such as Japan's from selling large amounts of Treasury securities, which could push interest rates higher. Still, these actions are small compared to the overall size of the Treasury market.
The accompanying chart helps put interest rates in a longer historical context. Rates today are high compared to the past two decades, especially relative to the period when the Federal Reserve (the U.S. central bank) held rates near zero for many years. However, it is easy to see that rates are not extreme by historical standards. In fact, higher rates also create more opportunities for investors to earn income from bonds in their portfolios.
Concerns about tariffs, the national debt, and interest rates could continue to grow as we approach the midterm elections in November. Investors should be careful not to let news headlines drive their portfolio decisions. History shows that markets have navigated many periods of trade and fiscal uncertainty, and that investors who kept a longer-term perspective were better positioned to reach their financial goals.
The bottom line? Tariff refunds and rising deficits are creating near-term fiscal challenges, but it is important to keep these developments in perspective. Maintaining a balanced portfolio aligned with long-term financial goals remains the best way to navigate periods of fiscal uncertainty.
References
- https://www.cbp.gov/trade/programs-administration/trade-remedies/ieepa-duty-refunds
- https://fiscaldata.treasury.gov/datasets/debt-to-the-penny/debt-to-the-penny
- https://storage.courtlistener.com/recap/gov.uscourts.cit.17270/gov.uscourts.cit.17270.25.1.pdf#page=3
- https://fiscaldata.treasury.gov/datasets/monthly-treasury-statement/receipts-of-the-u-s-government
- https://fiscaldata.treasury.gov/americas-finance-guide/national-deficit
- https://www.cbo.gov/system/files/2026-08/61983-2026-07-MBR.pdf
- https://home.treasury.gov/news/press-releases/sb0607
Securities and advisory services offered through LPL Financial, a registered investment advisor. Member FINRA/SIPC; All investing involves risk including loss of principle. No strategy assures success or protects against loss.
Financial Advisors do not provide specific tax/legal advice and this information should not be considered as such. You should always consult your tax/legal advisor regarding your own specific tax/legal situation.
Separate from the financial plan and our role as a financial planner, we may recommend the purchase of specific investment or insurance products or account. These product recommendations are not part of the financial plan and you are under no obligation to follow them.
Life insurance products contain fees, such as mortality and expense charges (which may increase over time), and may contain restrictions, such as surrender periods.
Securities and Advisory Services offered through LPL Financial, a Registered Investment Advisor. Member FINRA & SIPC.
This material is for general information only and is not intended to provide specific advice or recommendations for any individual. There is no assurance that the views or strategies discussed are suitable for all investors or will yield positive outcomes. Investing involves risks including possible loss of principal. No investment strategy or risk management technique can guarantee return or eliminate risk in all market environments Any economic forecasts set forth may not develop as predicted and are subject to change.
References to markets, asset classes, and sectors are generally regarding the corresponding market index. Indexes are unmanaged statistical composites and cannot be invested into directly. Index performance is not indicative of the performance of any investment and do not reflect fees, expenses, or sales charges. All performance referenced is historical and is no guarantee of future results.
This information is not intended to be a substitute for specific individualized tax or legal advice. We suggest that you discuss your specific situation with a qualified tax or legal professional.
Bonds are subject to market and interest rate risk if sold prior to maturity. Bond values will decline as interest rates rise and bonds are subject to availability and change in price.
U.S. Treasury securities are guaranteed by the federal government as to the timely payment of principal and interest. The principal value of Treasury securities and other bonds fluctuates with market conditions.
International investments carry additional risks, which include differences in financial reporting standards, currency exchange rates, political risks unique to a specific country, foreign taxes and regulations, and the potential for illiquid markets. These factors may result in greater share price volatility.
This material was prepared by Clearnomics, Inc., who is not affiliated with the named financial professional, firm or broker/dealer.
Copyright (c) 2026 Clearnomics, Inc. All rights reserved. The information contained herein has been obtained from sources believed to be reliable, but is not necessarily complete and its accuracy cannot be guaranteed. No representation or warranty, express or implied, is made as to the fairness, accuracy, completeness, or correctness of the information and opinions contained herein. The views and the other information provided are subject to change without notice. All reports posted on or via www.clearnomics.com or any affiliated websites, applications, or services are issued without regard to the specific investment objectives, financial situation, or particular needs of any specific recipient and are not to be construed as a solicitation or an offer to buy or sell any securities or related financial instruments. Past performance is not necessarily a guide to future results. Company fundamentals and earnings may be mentioned occasionally, but should not be construed as a recommendation to buy, sell, or hold the company's stock. Predictions, forecasts, and estimates for any and all markets should not be construed as recommendations to buy, sell, or hold any security--including mutual funds, futures contracts, and exchange traded funds, or any similar instruments. The text, images, and other materials contained or displayed in this report are proprietary to Clearnomics, Inc. and constitute valuable intellectual property. All unauthorized reproduction or other use of material from Clearnomics, Inc. shall be deemed willful infringement(s) of this copyright and other proprietary and intellectual property rights, including but not limited to, rights of privacy. Clearnomics, Inc. expressly reserves all rights in connection with its intellectual property, including without limitation the right to block the transfer of its products and services and/or to track usage thereof, through electronic tracking technology, and all other lawful means, now known or hereafter devised. Clearnomics, Inc. reserves the right, without further notice, to pursue to the fullest extent allowed by the law any and all criminal and civil remedies for the violation of its rights.
